27 Years of LBI Oceanfront Data Analysis
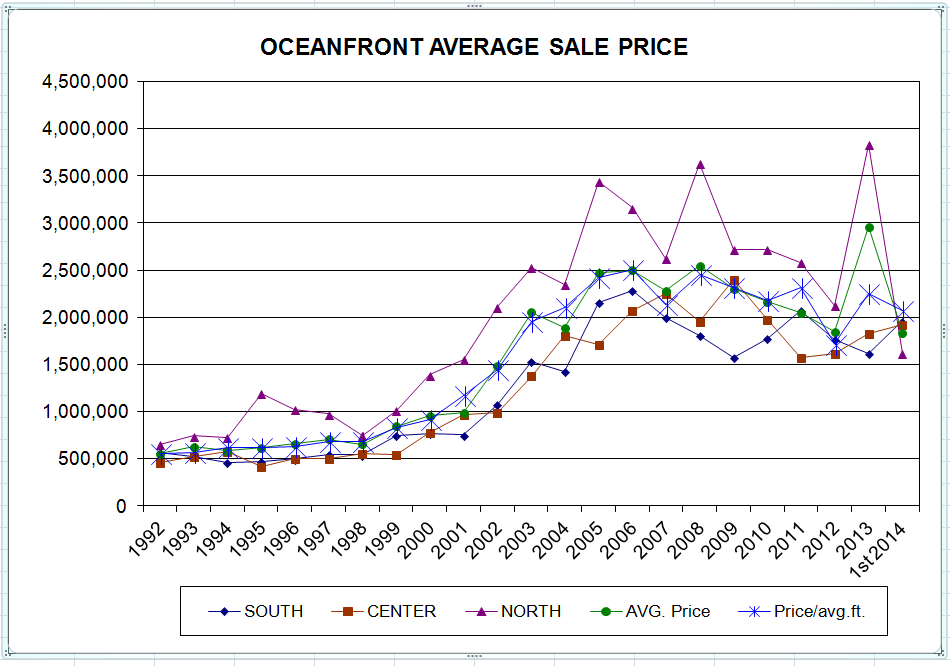
In 1987, the Oceanfront sales market had peaked on LBI. Six and seven years later I was selling oceanfront homes for approximately 25% less than the 1987 climatic sales market. Then Oceanfront land began appreciating slowly from 1992 to 1998. In that time period, the average oceanfront home increased a total of 24%. Over the next seven years (1999-2006), they increased another 329% – bringing total appreciation up 353% from the low of 1992 to the high of 2006! The average oceanfront value in 1992 was $553,844 and had peaked in 2006 to $$2,508,891. (Multiplied by 453%, subtracting the initial price brings us up 353%).
I feel history is repeating itself with approximate timing, appreciation & depreciation. We have already experienced the seven or so years of a depreciating LBI home sales market from the 2006 peak. From the peak, values were down approximately 20% on oceanfront and approximately 30% on bayfronts. Oceanfronts are slowly going back up in value and bayfronts should follow soon.
Most Buyers are more likely to purchase a property if the Seller is asking a fair price reflective of today’s market value. These buyers are excited that they are able to afford a vacation home on LBI! With attractive mortgage interest rates and competitive asking prices, along with a variety of properties to choose from, it’s a great time to buy or sell on LBI!
As the Waterfront Specialist, Willy publishes the Oceanfront Newsletter with statistics of all MLS single family home Oceanfront Sales since 1992.
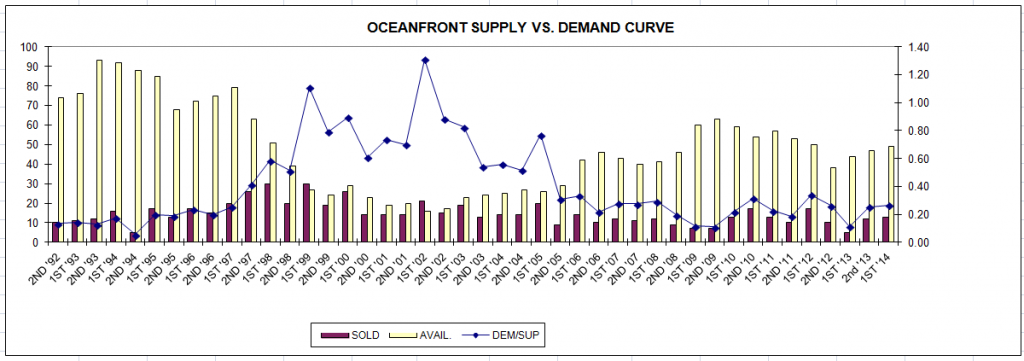
Supply vs. Demand
The Oceanfront Newsletter contains statistics of all MLS Oceanfront single family home Sales since 1992 including average sale prices on oceanfront properties, LBI single home oceanfront sales spreadsheet, Supply vs. Demand curve, and data analysis.
Mid 2014 Oceanfront Newsletter
In 2013, the average oceanfront price on LBI had increased to an all time record high of $2,959,529 during 2013! This over inflated price was partly due to the numerous sales of oceanfront property on the north end of the Island which increased values much higher than expected. In general oceanfront property values have turned around and are beginning to appreciate once again!
During the 1st half of 2014, the average oceanfront property sold has been much smaller in size than those sold last year. We had an average of 84’ of ocean frontage sold in 2013 versus our average this year of 64 feet on the oceanfront.
The average price of an oceanfront sale this 1st half of 2014 has a deflated value of $1,834,692 (vs. $1,851,048 average in 2012). The average oceanfront property sold also had 64 linear feet on the oceanfront (vs. 69 in 2012 and 84’ in 2013). Seven of the thirteen sales this first half of 2014 were tear down Oceanfront homes, bringing prices down tremendously.
Oceanfront data varies so much that I have computed a more leveraged curve by calculating the price per foot of ocean frontage for single family oceanfront properties. To see how much an oceanfront property is valued the following numbers should be multiplied by the oceanfront footage. The average sale prices per linear foot each year are as follows: $7,662 in 1992, $29,069 in 2004, $33,466 in 2005, $34,709 in 2006, $29,618 in 2007, $33,971for 2008, $31,966 for 2009, $30,102 for 2010 and $32,061 for 2011. With the numerous teardowns which have sold, 2012 held a value of only $26,827 per linear foot. 2013 increased to a record high of $35,232 per linear foot. So far this year we are back to $28,667 per linear foot, due to so many tear downs selling for land value. Of course this average varies from town-to-town, condition of home, and depth of lot.
To calculate the current value of an average oceanfront property multiply the amount of oceanfront feet by $26,826 (if older home) to $35,232(if newer home in excellent condition with a deep lot and a tranquil location). From 1992 to present the average linear foot calculates to 72.28 feet of ocean frontage per sale.
The yearly sale prices vary more than anticipated because of the type of oceanfront properties that have sold. In 2006 many oceanfront homes that sold were new construction, bringing higher than expected values. In 2007 the majority of oceanfront properties that sold were teardowns, creating a decline in values. In 2008 the sale of oceanfront property in North Beach, Loveladies, and on oversized lots in Barnegat Light increased the average values for two reasons. The majority of homes were newly constructed and north end of the Island locations also hold the highest land values on LBI. These sales created a higher than average sale price for oceanfront properties than expected in 2008. In 2009 there were not any north end properties that sold. In 2010 the number of north end properties that sold were below average, bringing average prices down. In 2011, new construction in North Beach included an entire tract which brought our average value up a bit. In 2012 many tear downs sold along with just two new construction and one 5 years of age, bringing values down from 2011. The first half of 2013 we were back up a bit, which is great considering mostly teardowns have sold, and proves values are once again appreciating. The second half shows an unrealistic rate, where most properties sold were on the North end are in great condition, setting a record all time high average sale price!
Sign up HERE to receive your FREE LBI Oceanfront Newsletter with Oceanfront single family home statistics by email. If you prefer a hard copy, include your mailing address.
 " alt="LBI Waterfront Real Estate" />


